1. INTRODUCTION
Fiber-optic communication is the most common way of transmission of information in the modern world. In the field of telecommunications, digital data transmission systems are mostly employed. However, the simplest analog systems with RF/microwave intensity modulation of the light produced by a semiconductor laser (direct modulation by varying the drive current of the laser or external modulation by an electro-optic modulator), transportation of the optical signal through an optical fiber and, finally, direct detection of the optical signal by a photodiode at the output of the fiber, are in demand for a variety of applications. Among them are, for example, radio over fiber systems, on-board fiber-optic links, systems of control of positionally spaced radars, antenna remoting and many others. Analog fiber-optic links (AFOLs) are often the only option for such systems, and, at the same time, they offer a reliable and cost-effective solution.
However, AFOLs have significant disadvantages. The most considerable of them are the linear and nonlinear distortions of transmitted signals. The linear distortions manifest themselves in irregularity of the intensity modulation response, namely in a suppression (down to the noise level) or revival of signals at the output of the fiber, which occur at certain modulation frequencies [1-4]. Such behavior is typical for the AFOLs employing standard single-mode fiber and single-frequency semiconductor lasers with the wavelength of 1550 nm. The primary reason for the linear distortions is the group velocity dispersion of electromagnetic waves in the fiber. Some compensation techniques of such distortions are discussed in [5-8].
At a high density of optical power in a fiber, the various nonlinear optical phenomena leading to nonlinear distortions of the transmitted signals start to play an appreciable role. The basic reason for these phenomena is the changes in optical properties of the fiber medium due to interaction of an intense laser light with matter. Dispersion of the group velocity of electromagnetic waves in a fiber and the frequency chirp [10-12] of laser light give rise to the nonlinear distortions of a special type. Such distortions are not related with the optical power of transmitted signals and occur even at low laser light intensities. They manifest themselves in generation of the higher order harmonics that are not presented in the original signal of modulation.
In this paper we present theoretical and experimental results of the study on transmission of signals in AFOLs with direct or external modulation of laser light intensity and direct detection of the optical signal by a photodiode at receiver end of the fiber. We consider consecutively all the stages of signal transmission. First, the conversion of an electrical signal to an optical signal of light intensity modulation, then, transportation of the optical signal through a single-mode fiber with chromatic dispersion and finally, the conversion of the optical signal back to the original electrical format by a photodiode at the output of the fiber. We examine in detail the impact of frequency chirp on linear and nonlinear dispersive distortions of signals. For several AFOLs of different lengths we experimentally obtain the dependence of the output power of the optical signals versus the modulation frequency. The contribution of higher order harmonics of the modulation frequency is theoretically and experimentally investigated. We compare the dispersive harmonic distortions of the optical signals produced by two different light sources: directly-modulated semiconductor laser (with chirp) and externally-modulated semiconductor laser (without chirp).
It is worth noting that in the majority of studies of AFOLs, either numerical analysis [1, 13] or rather complicated mathematical apparatus [14] are usually used. This makes difficult obtaining the simple analytical expressions suitable for the engineering design of the fiber-optic links. This paper is intended to fill this gap. We derive a simple analytical expression for the frequencies of the signals with minimum or with maximum power at the output of a fiber, as well as a simple analytical expression for the frequencies at which one can expect the minimum dispersive harmonic distortions.
2. TRANSMISSION OF SIGNALS IN AFOLs WITH DIRECT LASER LIGHT INTENSITY MODULATION
2.1. Electrical-to-optical conversion
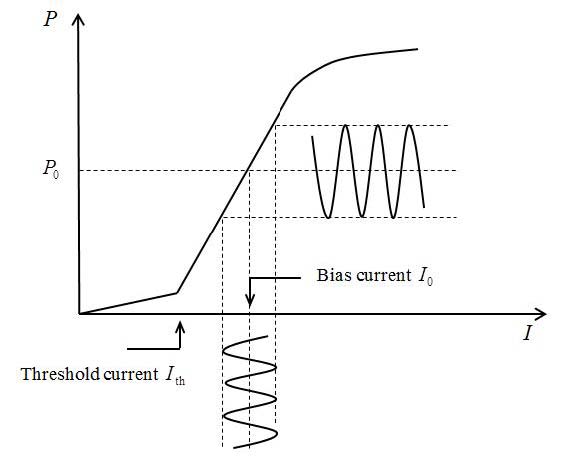 |
| Fig. 1. Watt - ampere characteristic of a semiconductor laser. |
Varying the drive current of a semiconductor laser is the easiest way to convert electrical signals into optical ones. In modern lasers such a conversion, within the range of modulation frequencies up to 35 GHz, is usually accompanied by the minimal nonlinear distortions, so that in the above-threshold regime of generation and at moderate radiation powers the watt-ampere characteristic of a semiconductor laser (Fig. 1) is well described by a linear function. Therefore, the electric signal of current modulation
| I = I0[1 + mcos(ωmt + φm)], | (1) |
where I0 is the bias current, which shifts the laser operation point on the linear part of the watt-ampere characteristic and m is the depth of modulation, will be converted into an optical signal of the laser light power
| P = P0[1 + mcos(ωmt + φm)] | (2) |
with the same angular modulation frequency ωm and the phase φm.
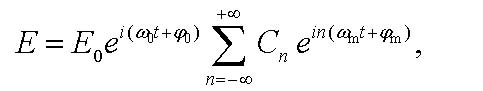
The complex electric field E(t) of the associated electromagnetic wave with the carrier frequency ω0 and the phase φ0 is given by
 |
(3) |
This expression can be expanded into a power series in m. If we restrict ourselves only to the first-order term (it can be done at a small modulation depth m << 1), we come to the spectrum consisting of the carrier frequency ω0 and two sidebands with the frequencies ω0 ± ωm. Such a spectrum is typical for amplitude modulation.
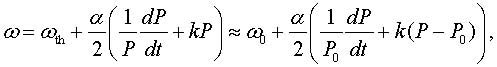
It should be noted, however, that equation (3) does not take into account a parasitic phase (and therefore frequency) modulation of the electromagnetic wave – the effect which is referred to as the frequency chirp of laser light. Indeed, the injection current modulation produces a variation in charge carriers concentration, which leads to a variation in the refractive index of the laser active region and, therefore, to a frequency modulation of laser light. Effect of the frequency chirp on light produced by a directly-modulated laser is usually written in the form of relation between the instantaneous frequency ω and the instantaneous power P of the laser radiation, namely [10-12],
 |
(4) |
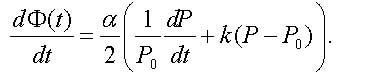
where α is the linewidth enhancement factor, also known as Henry factor, and k is a laser-specific parameter known as the adiabatic chirp coefficient. One can see from (4) that in the laser operating point with the output light power P0 the carrier frequency is equal to ω0 = ωth + (α/2)kP0 and it differs from the frequency ωth at the lasing threshold by the value of (α/2)ωc , where ωc = kP0 is the characteristic frequency of adiabatic chirp. With account of the frequency chirp, the phase φ0 in (3) will not be a constant and should be replaced by the function Φ(t), which is determined from the equation
 |
(5) |
Typical values of the chirp parameters for DFB InGaAs lasers (emission wavelength 1550 nm) are as follows [12]: α is within the range from 2 to 4, and the characteristic frequency of adiabatic chirp fc = ωc/2π varies from 1 to 3 GHz at the optical power P0 = 1 – 2 mW.
Integration in (5) yields the following expression for the phase
| Φ(t) = Msin(ωmt + φm + ψm) + φ0, | (6) |
where φ0 is the integration constant and
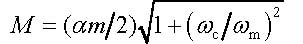 |
(7) |
is the amplitude of phase modulation, ψm is an additional phase shift with respect to the signal modulation phase φm, and ctgψm = ωc/ωm.
Thus, the electric field of the chirped electromagnetic wave can be represented at a small modulation depth m << 1 in the form
 |
(8) |
The spectral representation of such a wave is given by the sum
 |
(9) |
with
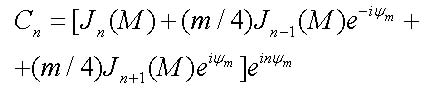 |
(10) |
and it can be obtained with the help of well-known Jacobi-Anger expansion [15] in Bessel functions of the first kind Jn of order n. One can see that the spectrum of the chirped wave (9) consists of the carrier frequency ω0 and an infinite number of sidebands with the frequencies ω0 + nωm (where n = ±1, ±2, ±3...), which are shifted left and right from ω0 by the interval equal to the modulation frequency ωm.
2.2. Transportation of optical signals through a fiber
As is known, the electric field in a mode of an optical fiber has the form E = E0(r,φ)ei(ωt-βz), where β is the mode propagation constant. With the same type of electric field distribution E0(r,φ) in the cross section of a single mode fiber, it can guide a variety of light waves with different frequencies. Chromatic dispersion of these waves, which is expressed in dependence of the propagation constant β on frequency ω, can result in severe degradation of the transmitted signals.
In the vicinity of the carrier frequency ω0 the function β(ω) can be represented as a power series β(ω) = β0 + β1(ω – ω0) + (β2/2)(ω – ω0)2 + ..., where β0 is the propagation constant at the carrier frequency, β1 = 1/u is equal to the inverse group velocity, u = dω/dβ, at the carrier frequency and the coefficient β2 is associated with the group velocity dispersion. It can be determined through the so-called chromatic dispersion coefficient D of a fiber by means of the well-known relation [9] β2=-λ02D/2πc where c – the speed of light in vacuum, λ0 – laser emission wavelength. Typical values for D at the emission wavelength 1550 nm are in the range (16 – 18) ps/(nm km).
In propagation through the fiber the different harmonics in the wave (9) acquire different phase changes due to dispersion. In particular, for the harmonic with frequency ω0 + nωm after passing through a fiber of length L the phase shift is -βL=-β0L-β1nωmL-1/2β2n2ωm2L-... As a result, at the fiber output we have the wave
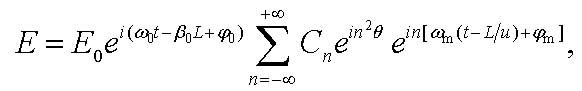 |
(11) |
where
| θ = πc(ωm/ω0)2DL | (12) |
is the signal transportation parameter.
2.3. Photocurrent
A photodiode placed at the receiver end of the fiber, converts the optical signals back to the original electrical format. Since the photodiode is a square-law device, it produces a photocurrent I(t) that is directly proportional to the square modulus of the electric field magnitude E(t). We write down the photocurrent as
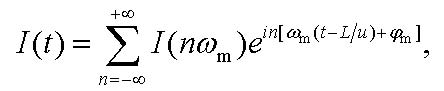 |
(13) |
where
 |
(14) |
is the complex amplitude of photocurrent at the n-th harmonic and R is the photodiode responsivity at the laser emission wavelength. For the calculation of |E(t)|2 = E(t)E*(t) with the electric field (11) we apply Graf's addition theorem for the Bessel functions [15], which can be rewritten in the form
 |
where the complex number z3eiγ is the sum of two other complex numbers z1eiα and -z2e-iβ. As a result, we obtain in the first order in m the following expression [14]
 |
(15) |
where
| Un = 2Msinnθ. | (16) |
Compare the photocurrents that could be produced by the optical signal at the input and at the output of the fiber. At the input we have L = 0 so that θ (12) and Un (16) are equal to zero as well. Bearing in mind that J0(0) = 1, while the rest of Bessel functions in (15) vanish at the coordinate origin, we obtain
| I(t) = RP0[1 + mcos(ωmt + φm)]. | (17) |
Spectrum of the photocurrent (17) consists of a zero-frequency term (direct current) and two terms at the sideband frequencies +ωm and –ωm. As expected, the photocurrent reproduces the initial electrical signal (1) of current modulation.
The photocurrent (13), detected at the output of a fiber of length L, reveals the propagation time delay L/u, where u is the optical signal group velocity. It contains the direct current term I(ω = 0) = RP0 and, in general case, an infinite number of harmonics at frequencies nωm with n = ±1, ±2, ±3... In particular, when n = 1 we have for the complex amplitude (15) the expression
 |
(18) |
Comparing the output complex amplitude (18) with the corresponding input complex amplitude, mRP0/2 (17), we come to the following transfer function
 |
(19) |
which establishes relation between the photocurrents that could be produced by an optical signal before and after propagation through a fiber of length L at the modulation frequency ωm. Separating the amplitude and the phase of the transfer function (19), H(ωm,L) = |H(ωm,L)|eiχ, we can rewrite the photocurrent as
I(t) = RP0m|H(ωm,L)|cos[ωm(t – L/u) + φm +χ].
One can see that modulus of the transfer function (19) determines the relative amplitude of the electrical signal detected at the fiber output.
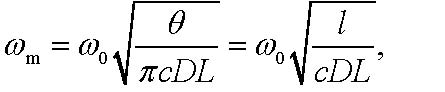
Consider some special cases. In the simplest case of a laser source without chirp, the amplitude M (7) of phase modulation is equal to zero and, therefore, U1 = 0. So that the modulus of the transfer function (19) is reduced to |H(ωm,L)| = |cosθ| [1, 2]. With the help of (12) it is clear now that the signals with the frequencies, which can be determined from the equation θ = π/2 + lπ, with l = 0, 1, 2, 3..., vanish at the fiber output.
For chirped laser sources the transfer function (19) can be simplified by applying the small-signal approximation. At small values of U1 we can restrict ourselves only to the first-order terms in power series of Bessel functions in (19). In this case, the transfer function modulus can be written as [16-18]
| |H(ωm,L)| = |cosθ – α(1 – iωc/ωm)sinθ|. | (20) |
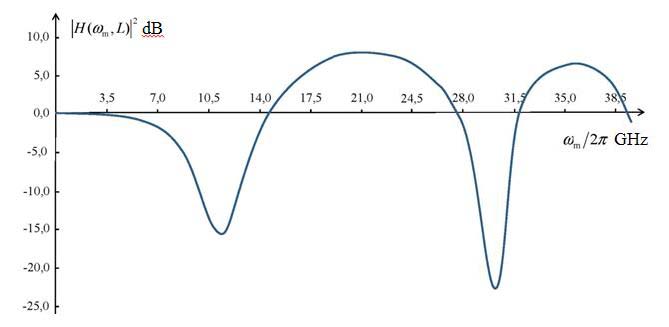 |
| Fig. 2. Plot of the intensity modulation response of an analog fiber-optic link with direct modulation of laser light intensity and direct detection of the optical signal. |
Fig. 2 shows a typical plot of the squared modulus of the transfer function (20), |H(ωm,L)|2, expressed in dB against the modulation frequency fm = ωm/2π for the optical fiber of length L = 10 km with the fiber dispersion coefficient D = 17 ps/(nm km), the laser emission wavelength λ0 = 1550 nm and the chirp parameters: α = 2, fc = ωc/2π = 2 GHz.
For extrema of the function |H(ωm,L)|2 we can obtain the following expression
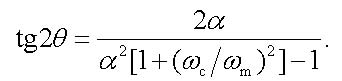 |
(21) |
For a given fiber length L this expression together with equation (12) specifies implicitly the frequencies at which the signal power extrema occur. As it can be seen from fig. 2, for the frequencies near to the power extrema we have (ωc/ωm)2 < < 1 and, therefore, this term in (21) can be neglected. In this case, we can get a very simple condition for the frequencies of the power extrema, namely, θ = –arctgα + lπ/2 where odd positive integers l give the local minima, whereas even positive integers l give the local maxima. At the local minima, the squared modulus of transfer function is
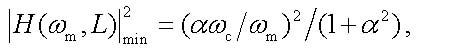 |
(22) |
whereas at the local maxima we have
 |
(23) |
Note also that it is possible to obtain analytical expressions for zeros of the function in fig. 2 (in these points the modulus of transfer function (20) is equal to unity). Solution of the corresponding trigonometric equation contains the two sets of roots: for the odd zeros in fig. 2, we have sinθ = 0 which yields θ = lπ with non-negative integers l = 0, 1, 2, 3..., whereas for the even zeros we obtain
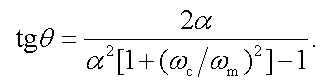 |
(24) |
As in equation (21), the term (ωc/ωm)2 in (24) can be neglected. Then we obtain for the even zeros the following condition θ = –2arctgα + lπ with positive integers l = 1, 2, 3... .
2.4. Harmonic distortions of transmitted signals
At a high density of optical power in a fiber, the various nonlinear optical phenomena leading to nonlinear distortions of the transmitted signals start to play an appreciable role. The primary reason for these phenomena is the changes in optical properties of the fiber medium caused by interaction of the intense laser light with matter. Impact of the optical nonlinearity becomes noticeable at the laser light powers exceeding 10 mW. First of all it concerns to the stimulated Brillouin scattering, while the optical power threshold for the stimulated Raman scattering is much higher and amounts to approximately 1 W.
Dispersion of the group velocity of electromagnetic waves in a fiber together with the frequency chirp of laser light give rise to the nonlinear distortions of a special type. Such distortions are not related to the optical power of transmitted signals and occur even at low laser light intensities. Indeed, let’s compare the photocurrents that could be produced by the optical signal at the input and at the output of a fiber. In accordance with (17), the input optical signal produces a single-tone electrical signal of photocurrent with the frequency ωm. As it can be seen from the expression (13) with the complex amplitudes (15), spectrum of the photocurrent detected at the receiver end of the fiber contains, in addition to the term with the frequency ωm, also the higher order harmonics. In other words, the optical signal transmitted through a fiber undergoes the dispersive harmonic distortions.
It is important to emphasize that we treat the optical fiber as a linear medium and the primary reason for the harmonic distortions is the group velocity dispersion of light waves and the frequency chirp of light produced by a directly-modulated laser. Note, however, that the presence (due to the chirp) in spectrum of the input wave (9) an infinite number of sidebands, still does not mean nonlinearity of the detected photocurrent. Phase relations between the harmonics in the input wave (9) are such that the photocurrent (17) remains a single-tone electrical signal. After linear propagation through a fiber the different spectral components of the wave (11), associated with the chirped optical signal, acquire different phase changes due to dispersion. This leads to appearance in the detected photocurrent the higher order harmonics which are not presented in the original signal. The principal difference of the dispersive harmonic distortions is that they occur in the electromagnetic wave envelope, rather than in the carrier as it would be, when the light propagates through a nonlinear medium.
On the other hand, if there were no frequency chirp, the amplitude of the phase modulation M (7), and hence, Un (16) would be equal to zero. Bearing in mind that in (15) J0(0) = 1, while the rest of Bessel functions vanish at the coordinate origin, we obtain for the photocurrent detected at the fiber output a single-tone electrical signal with frequency ωm without any dispersive harmonic distortions (in the first order in the depth of modulation m). At the same time, the linear distortions of the output signals are presence and can be described by the transfer function H(ωm,L) with the modulus equal to |cosθ|.
It is interesting to note, that in the odd zeros of the function 10lg|H(ωm,L)|2 in fig. 2, when sinθ = 0 (which yields θ = lπ with non-negative integers l), all the complex amplitudes (15), except the zero with n = 0 and the first one with n = 1, are vanish. Hence, the transmission of signals with the frequencies
 |
(25) |
where l =1, 2, 3..., are not subjected to the harmonic distortions (in the first order in the depth of modulation m). The modulus of transfer function for these signals is equal to unity, that is the power of signals at the input and at the output of the fiber are equal to each other (without attenuation in the fiber). For the fiber-optic link with parameters used in fig. 2, we obtain for the frequencies (25) the following estimates: fm1 = 27.93 GHz and fm2 = 39.49 GHz.
Usually, the main contributions to the nonlinear distortions make the second and the third harmonics. However, these contributions disappear at the certain frequencies. As it can be seen from (15), the complex amplitude of the second harmonic vanish at sin2θ = 0 (which yields θ = lπ/2 with non-negative integers l), whereas for the third harmonic the similar condition looks like sin3θ = 0 (which yields θ = lπ/3 with non-negative integers l). With the parameters used in fig. 2, we obtain the following estimates: fm1(2)=ωm1(2)/2π=19.75 GHz and fm2(2)= 27.93 GHz (at these frequencies the second harmonic disappears) and fm1(3)=ωm1(3)/2π= 16.13 GHz and fm2(3)= 22.80 GHz (at these frequencies the third harmonic disappears).
One can see from fig. 2 that for the AFOLs with the above specified parameters, the most attractive operation area is located in the frequency domain from 19 to 23 GHz. In this area the electrical-to-optical conversion occurs with relatively small distortions. In this area it takes place the dispersive power enhancement of the output signal. This area is characterized by relatively low linear distortions of the output signal. Finally, in this area the second or the third harmonics disappear (at 19.75 GHz and 22.80 GHz, respectively), and, consequently, it is possible to minimize the signal harmonic distortions.
3. TRANSMISSION OF SIGNALS IN AFOLs WITH EXTERNAL LASER LIGHT INTENSITY MODULATION
3.1. Mach-Zehnder modulator
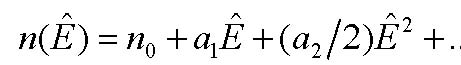
Operation of most optical modulators is based on the electro-optic effect [19], consisting in a change of the refractive index n or birefringence in some crystals (potassium dihydrogen phosphate – KH2PO4 (KDP), barium titanate – BaTiO3, lithium niobate – LiNbO3, lithium tantalite – LiTaO3 and others), which results from the application of an electric field Ê. For classification of the electro-optic effect, we expand the function n(Ê) in a power series
 , , |
(26) |
where an=(dnn/dÊn)|E=0. If the third term can be neglected, then n is a linear function of the electric field Ê (Pockels effect). The Pockels effect can occur only in the crystals with non-centrosymmetric lattice. If the coefficient a1 = 0, the quadratic dependence the refractive index n on the electric field is advanced to the forefront (Kerr effect). Electro-optic effect is very fast (the response time is about 10−10 ÷ 10−11 c), so that, in principle, the upper limit of the modulation frequency can reach 100 GHz (in practice, the –3 dB modulation bandwidth of modern modulators amounts to 40-50 GHz). We consider in more detail the electro-optic modulator of laser light intensity, based on the Mach-Zehnder interferometer.
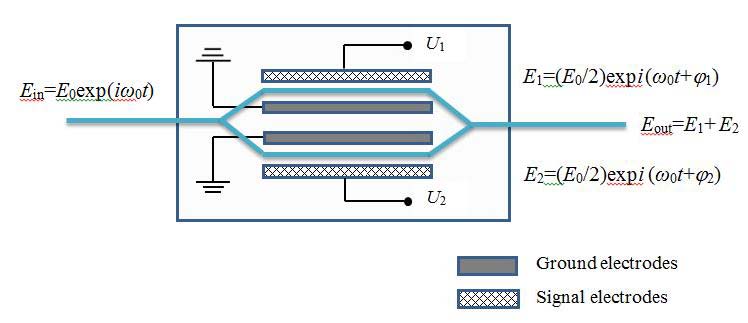 |
| Fig. 3. Schematic diagram of the dual-drive Mach–Zehnder modulator. |
Schematic diagram of the Mach-Zehnder modulator is shown in Fig. 3. The modulator consists of a system of optical waveguide channels with one input and one output, which are formed on a monocrystalline substrate (most often from lithium niobate) by thermal diffusion of titanium. The input optical channel is split into two independent waveguides providing a spatial separation of the input light beam into two identical beams which are then combined together at the output channel. A number of electrodes are mounted on the substrate at both sides of the waveguides. The voltage applied to these electrodes creates an electric field penetrating into the cross section of each of the waveguides. The input light beam should be polarized in the direction of the electric field strength. Orientation of the substrate crystal provides the appearance of the linear electro-optic Pockels effect. By applying a drive voltage to the electrodes, a phase difference between the split light beams is created, and then interference occurs as a result of their combination in the output channel. The light beam intensity at the output of the modulator depends on the phase difference, which, in turn, is determined by the drive voltages in the arms of the interferometer (dual-drive Mach–Zehnder modulator).
The input electromagnetic wave with the frequency ω0 and the electric field E is split in the modulator with symmetric waveguide geometry (fig. 3) into two waves of equal amplitude E0/2. At the modulator output we obtain
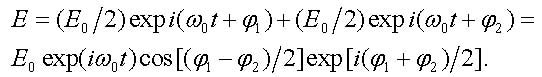 |
(27) |
The phase changes φ1 and φ2, acquired each of the waves on passing through their own waveguides of the length L and the thickness d, are determined by the drive voltages U1 and U2. Since the Pockels effect is linear, the reversal in direction of the applied electric field ˆ
E, results in the reversal in sign of the change of the refractive index. Therefore, we have
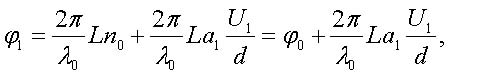 |
(28) |
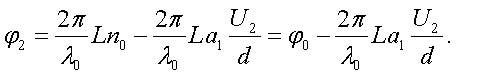 |
(29) |
To quantify the Pockels effect in the modulator with a given geometry, the voltage U1 = U2 = Uπ, is used at which the phase difference of (28) and (29) due to action of the electric field is equal to π. At this voltage the output electromagnetic waves cancel each other and the light intensity becomes equal to zero. The voltage Uπ is specific to each device and it is called the half-wave voltage of the modulator. With the help of this parameter, the wave (27) takes the form
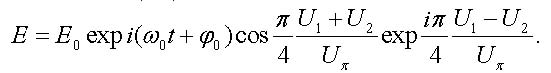 |
(30) |
By varying the drive voltages U1 and U2, the electric field (30) turns out to be modulated not only in the amplitude but in the phase as well. Thus, the output light wave is subjected to the frequency chirp [20-22]. It is evident, however, that by applying the equal voltages U1 = U2 = U one can get rid of the chirp and this is an important advantage of the external modulation of light intensity as compared with direct modulation. The electric field of the chirp-free electromagnetic wave takes the form
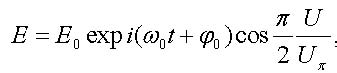 |
(31) |
and, hence, the intensity of light at the modulator output varies according to the law (we neglect the insertion loss)
| P=P0cos2[(ϕ1-ϕ2)/2]=P0cos2(π/2 U/Uπ) | (32) |
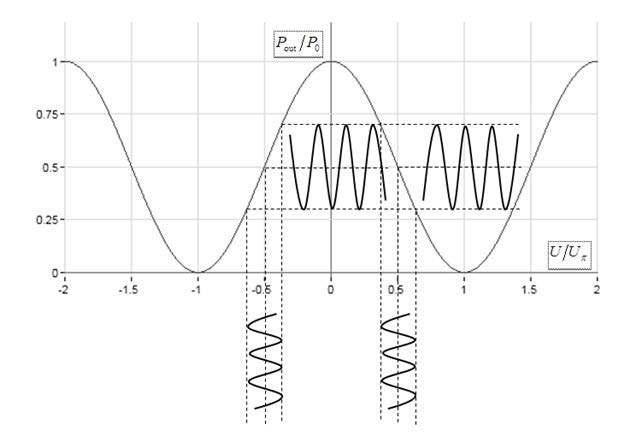 |
| Fig. 4. Modulation characteristic of Mach–Zehnder modulator: dependence of the relative light intensity P/P0 versus the normalized drive voltage U/Uπ. |
Fig. 4 illustrates the dependence of the relative light intensity P/P0 of the modulator versus the normalized drive voltage U/Uπ.
Let the normalized drive voltage is harmonically modulated as
| U/Uπ = u0 + ucos(ωmt + φm), | (33) |
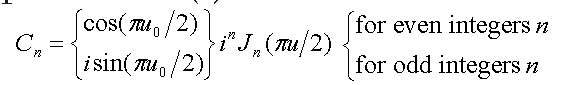
with the normalized bias voltage u0, the normalized voltage amplitude u, the modulation frequency ωm and the initial phase φm. The spectral representation of the optical signal (32),
 |
(34) |
includes, beside the fundamental harmonic at the modulation frequency, an infinite number of higher order harmonics at multiple frequencies. Thus, in contrast to the direct intensity modulation, the electrical-to-optical conversion with the help of Mach-Zehnder modulator turns out to be nonlinear.
The degree of nonlinearity can be reduced by the choice of the operating point of the modulator. Indeed, at certain normalized bias voltages equal to u0 = l + 1/2, where l = 0, ±1, ±2, ±3..., (the quadrature operating points), all even harmonics in (34) disappear and the spectrum contains only odd harmonics. The power of these harmonics at the normalized voltage amplitude, for example, u = 1/2 (this corresponds to 100% depth of modulation at the normalized bias voltage u0 = ±1/2) are proportional to J1(π/2) = 0.567, J3(π/2) = 6.894×10⁻² and J5(π/2) = 2.240×10⁻³, so that the power of the third harmonic amounts to –9.15 dB of the fundamental harmonic power, whereas the power of the fifth harmonic is –24.03 dB. At u = 1/4 we obtain J1(π/4) = 0.363, J3(π/4) = 9.696×10⁻³, J5(π/4) = 7.566×10⁻⁵, so that the third and the fifth harmonic powers are only –15.73 dB and –36.8 dB, accordingly. One can see, therefore, that at πu < 1 we can restrict ourselves only by the fundamental harmonic. In this approximation, the power of the output optical signal is reduced to
| P = P0[1/2 + (–1)l+1J1(πu)cos(ωmt + φm)]. | (35) |
It is worth noting that at even l the signal of light intensity modulation is out-of-phase with the drive voltage signal (33), whereas at odd l these signals are in-phase.
Comparison of Fig. 4 and Fig. 1 reveals an important feature of external modulation. The power of an externally modulated signal is proportional to the power of laser light P0, whereas the power of a directly modulated signal is independent of the optical power and it is determined solely by the laser slope efficiency.
In practice, the half-wave voltage Uπ of Mach-Zehnder modulator is subjected to drift and, therefore, the bias voltage should be continuously adjusted with the help of a special control circuit [23] in order to maintain performance of the modulator at the desired operating point. The lack of even harmonics at the quadrature operating points can be employed to adjust the bias voltage [24]. Such an adjustment is usually realized by means of a programmable voltage source with the regulation aimed at a suppression of the second harmonic in the light intensity modulation signal.
3.2. Transportation and photodetection of optical signals
Analysis of transportation of the optical signal (34) through a fiber can be performed in a manner similar to that it is used in Section 2.2. With the drive voltage modulation (33), the electric field (31) in the electromagnetic wave at the output of the modulator (at the input into a fiber) can be represented as a spectral sum (9) with the coefficients
 |
(36) |
After propagation through a dispersive fiber of the length L, this spectral sum is transformed to the form (11).
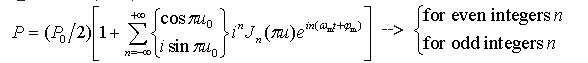
The photocurrent I(t) (13), detected by a photodiode at the output of the fiber, is directly proportional to the square modulus of the electric field E(t) (11) with the coefficients (36). The corresponding complex amplitudes I(nωm) of different harmonics of the photocurrent can be calculated with the help of Graf's addition theorem for the Bessel functions. They have the form
|
I(nωm)=R(P0/2)[(-1)nJn(πu sinπθ)+cos(πu0)inJn(πucosnθ)] for even integers n, |
(37) |
|
I(nωm)=R(P0/2)isin(πu0)inJn(πucosnθ) for odd integers n. |
Note, that at the quadrature bias voltages u0 = l + 1/2, where l = 0, ±1, ±2, ±3..., the photocurrent contains both even and odd harmonics of the fundamental frequency, despite the fact that the input optical signal (34) does not contain even harmonics.
In particular, for n = 1 the complex amplitude (37) takes the form
| I(ωm) = –R(P0/2)sin(πu0)J1(πucosθ). | (38) |
Comparing the photocurrent (38) with that could be produced by the optical signal at the input of the fiber (at L = 0), we come to the following transfer function
| H(ωm, L) = J1(πucosθ)/J1(πu). | (39) |
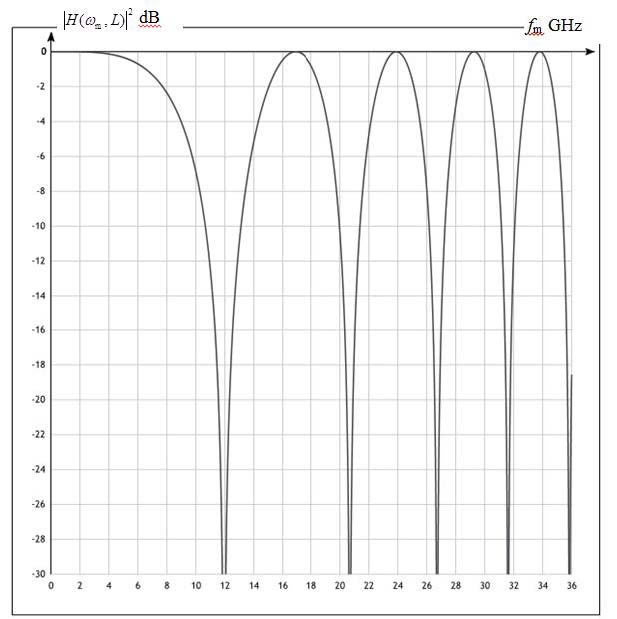 |
| Fig. 5. Plot of the intensity modulation response of an analog fiber-optic link with external modulation of laser light intensity and direct detection of the optical signal. |
Modulus of the transfer function (39) determines the relative amplitude of the electrical signal detected at the fiber output. In the area of our interest, when πu < 1, the absolute value of the transfer function (39) is not greater than unity. The function H(ωm,L) vanishes when cosθ = 0 and, therefore, the signals with the frequencies, determined from the condition θ = π/2 + lπ, where l = 0, 1, 2, 3..., vanish at the output of the fiber. At the frequencies, determined from the condition |cosθ| = 1, which yields θ = lπ with l = 0, 1, 2, 3..., the modulus of the transfer function (39) reaches the maximum value equal to unity and, thus, the power of signals at the input and at the output of the fiber are equal to each other (without attenuation in the fiber).
The function|H(ωm,L)|2 (39) (expressed in dB) versus the frequency of modulation fm = ωm/2π is the intensity modulation response of the considered AFOL. Fig. 5 shows a typical plot of this response in the area of small amplitudes of modulation πu < 1 for the optical fiber of length L = 25 km with the fiber dispersion coefficient D = 17 ps/(nm km). The laser light wavelength 1550 nm corresponds to the frequency f0 = ω0/2π = 193.414 ТHz.
3.3. Harmonic distortions of transmitted signals
The original signal of voltage modulation (33) is a single-tone electrical signal with the frequency ωm. It is subjected to nonlinear distortions already at the initial stage of signal transmission – the electrical-to-optical conversion. And although by the choice of the quadrature bias we can eliminate the contribution of all even harmonics of the modulation frequency ωm, and by the restriction πu < 1 of the modulation voltage amplitudes we can significantly reduce the contribution of odd higher harmonics, the nonlinear distortions, caused by operation of the Mach-Zehnder modulator, are basically unavoidable.
After transportation through a dispersive fiber, the optical signal can acquire additional harmonic distortions. Such distortions are not related with the optical power of transmitted signals and occur even at low laser light intensities. One can see from the expression (37) that the photocurrent produced by the fiber output optical signal contains both even and odd harmonics of the modulation frequency despite the fact that the input optical signal contains no even harmonics. However, the correct choice of the signal transportation parameter (12), determined by the requirement |cosθ| = 1, ensures the suppression of all even harmonics, whereas the optical powers of odd harmonics in the input and output signals become equal to each other (without attenuation in the fiber). In this case, the harmonic distortions of the output signal are entirely determined by the nonlinear properties of the modulator. For other transportation parameters, the even harmonics are not only observed, but can provide a major contribution to the harmonic distortions of the signal.
4. EXPERIMENT
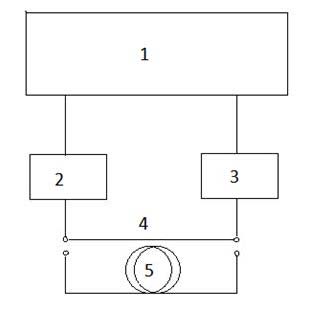 |
| Fig. 6. A block diagram of the stand for measuring the intensity modulation response of analog fiber-optic links of different length. |
A block diagram of the stand for measuring the intensity modulation response of analog fiber-optic links is shown in Fig. 6. The work procedure is as follows. The single-frequency 1550 nm DFB InGaAsP laser NLKC5EBKA (2) is connected to the input of photodetector U2t, XPDV2150R (3) by a short length of standard single-mode optical fiber (4) about 1 m long and then we determine visually on screen of the analyzer Agilent N5244A (1) the frequency range where the modulation response has no significant noise and sharp breaks. In this frequency range (in our case 10MHz – 35GHz) the signal power is normalized to unity. Then, the short cable (4) is replaced by a coil of long optical fiber (5) and the output signal is displayed on the screen of analyzer (1). Acting in a similar manner, we can get intensity modulation response for several lengths of a single-mode fiber. However, the laser light intensity should not be greater than 5-7 dBm because of the risk of stimulated Brillouin scattering and nonlinear distortions.
Fig. 7 shows the experimental curves for the output-to-input power ratio of the signals (expressed in dB) versus the modulation frequency fm for several coils of fiber of different length L with the dispersion coefficient D = 17 ps/(nm km).
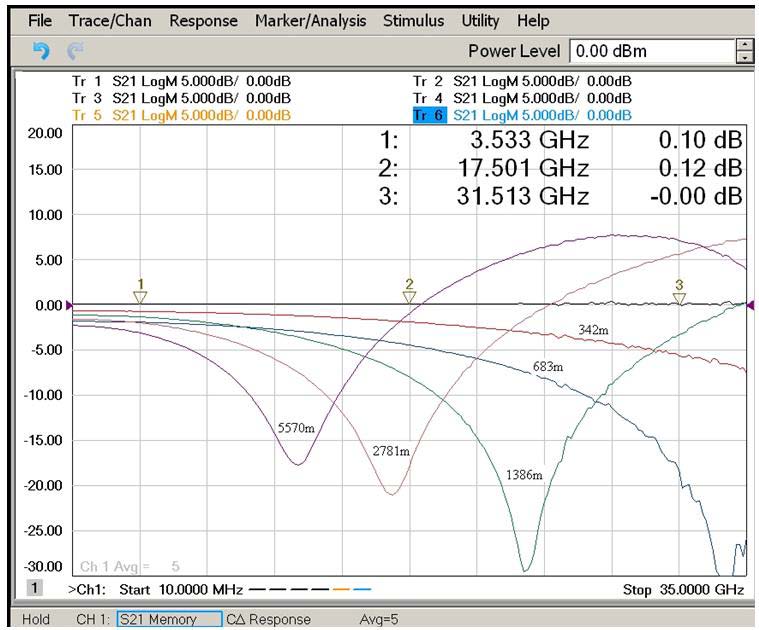 |
| Fig. 7. The intensity modulation response of several directly modulated analog fiber-optic links of different length. |
Nonlinear distortions manifest themselves in generation of the harmonics that are not presented in the original signal. Figs. 8, 9 represent the observed relative power of the 2nd and the 3rd harmonics, respectively, (harmonic-to-carrier power ratio) versus the power of signal. We use two different sources of light. The first source is a directly modulated single-frequency 1550 nm DFB InGaAsP laser (in the figures it is referred to as N43), built-in Agilent N4373A analyzer. The second source is the laser with an external chirp-free Mach-Zehnder modulator, which is not stabilized at the quadrature bias (in the figures it is referred to as L340). The 2.2 GHz signal of modulation is generated by Agilent E5071B with the microwave filter to suppress the intrinsic harmonic distortions. The optical signal is fed either directly to a photodetector Agilent N4373A, or through a coil of Corning fiber of 25266m length (in the figures it is referred to as AD-1). The power of harmonics in the output signal is measured by a spectrum analyzer Agilent E4404B in the segmented scanning mode.
5. DISCUSSION OF EXPERIMENTAL AND THEORETICAL RESULTS
One can readily see a qualitative consistency between the theoretical curve in fig. 2 and the experimental curves in fig. 7 for the intensity modulation response of the directly-modulated AFOLs. For a proper quantitative comparison between the theory and the experiment, the chirp parameters of laser source are necessary to know. Unfortunately, laser vendors do not specify the chirp parameters. We will rely on the data presented in [25] for the 1550 nm single-frequency InGaAsP lasers, namely: α = 2.8±0.2 and k = (11.4 ± 0.5) c–1mW–1 (the latter gives for the characteristic frequency fc = kP0/2π = (1.8 ± 0.1) GHz at the laser light power P0 = 1mW).
Let us estimate the chirp parameters of the laser used in our experiment. To determine the factor Henry α, we employ the result obtained from the equation (21) for the frequencies at which the signal power extrema occur
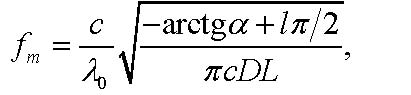 |
(40) |
where odd positive integers l give the local minima, whereas even positive integers l give the local maxima. One can see from fig. 7 that the dips in the output power occur at the frequencies: fm = 12.2 GHz for the fiber length L=5570 m, depth of the dip –17.5 dB; fm = 16.3 GHz for the fiber length L=2781 m, depth of the dip –21.0 dB; fm = 23.5 GHz for the fiber length L=1386 m, depth of the dip –28.5 dB. Wide maximum of the output power is observed within the frequency range 28.0 ÷ 28.2 GHz for the fiber length L = 5570 m, an increase in the power is +7.5 dB. The requirement of the best match between the experimental data and the calculations by the equation (40) leads to the estimate α = 2.9.
Using the obtained value of the factor Henry α, we can estimate the characteristic frequency fc of the adiabatic chirp by comparing of the theoretical values for the minima (22) and for the maxima (23) of the squared modulus of the transfer function with the corresponding experimental data for the relative power of signals at the output. The best match between the experimental data and the theoretical calculations provides the value fc = ωc/2π = 1.7 GHz. The obtained estimates indicate a good quantitative agreement between our experimental and theoretical results.
The experimental results of the study of harmonic distortions, shown in figs. 8 and 9, are also consistent with the theoretical conclusions presented in sections 2.4 and 3.3. Indeed, the relative powers of the 2nd and the 3rd harmonics of the signals produced at the output of directly-modulated laser N43 (with chirp) are extremely small and constitute less than –55 dBc and –70 dBc, respectively. Practically, the laser operates as a linear electrical-to-optical convertor. Recall that in the theoretical analysis we neglect the nonlinearity of the laser watt-ampere characteristic, and assume that the laser output is a single-tone optical signal (2). After transportation of the optical signal through the 25266 m fiber, the powers of the 2nd and the 3rd harmonics are significantly increased by 34 dBc and 36 dBc, respectively, and this increase is independent of the power. The latter illustrates the nature of dispersive harmonic distortions, which are not associated with the optical power of signals. The primary reason for the harmonic distortions is the frequency chirp of light produced by a directly-modulated laser and the group velocity dispersion of electromagnetic waves in a fiber.
Conversely, when we employ the L340 laser source with an external Mach-Zehnder modulator (without chirp), the inclusion into the optical circuit a fiber coil of 25266 m length practically does not change the relative powers of the higher order harmonics. This is consistent with the equations (37) and (34). Indeed, from the intensity modulation response shown in fig. 5 one can see that at the applied modulation frequency 2.2 GHz the squared modulus of the transfer function (39) is close to unity, so that we have cosθ ≈ 1. Therefore, the amplitudes of the second and the third harmonics after propagation through the fiber (they are accordingly proportional to J2(πucos2θ) and J3(πucos3θ)) are close to the amplitudes of these harmonics at the input of the fiber (proportional to J2(πu) and J3(πu)). Thus, the harmonic distortions in AFOLs with external intensity modulation (without chirp) are due to intrinsic nonlinearity of Mach-Zehnder modulator (in the domain of maximum signal transmission).
6. CONCLUSION
In this paper we have presented experimental and theoretical results on signal transmission in AFOLs with direct or external RF/microwave modulation of laser light intensity, transportation of the optical signal through a fiber and direct detection of the optical signal by a photodiode at receiver end of the fiber. We have experimentally obtained the intensity modulation response for several directly-modulated AFOLs of different lengths. We have demonstrated that the velocity dispersion of light waves in the optical fiber can cause severe degradation of the transmitted signals. They reveal ether power suppression or power revival depending on the modulation frequency. We have derived a simple analytical expression for the frequencies of the signals with minimum or maximum power at the fiber output.
We have examined dispersive harmonic distortions of the transmitted signals. We have found that such distortions are not related to optical power of the signals and occur even at low laser light intensities. The primary reason for the harmonic distortions is the frequency chirp of light produced by a directly-modulated laser and the group velocity dispersion of electromagnetic waves in the fiber. We have derived a simple analytical expression for the small-signal modulation frequencies at which there will be no dispersive harmonic distortions in directly-modulated AFOLs.
Chirp-free Mach-Zehnder external modulator has been examined as a solution to the problem of harmonic distortion. However, the modulation response of an ideal Mach-Zehnder modulator (even with no chirp) is found to be highly nonlinear and exhibits intrinsic harmonic distortions of the output optical signal. After propagation in a dispersive fiber this signal can acquire additional harmonic distortions. We have specified the signal transportation parameters and the operation conditions of Mach-Zehnder modulator, which ensure minimum harmonic distortions of the transmitted signals.
Theoretical calculations are in a good agreement with the experimental results and will be useful for the engineering design of analog fiber-optic links.
REFERENCES
1. Meslener GJ. Chromatic dispersion induced distortion of modulated monochromatic light employing direct detection. IEEE J. Quantum Electron., 1984, 20(10):1208-1216.
2. Wang J, Petermann K. Small signal analysis for dispersive optical fiber communication systems. Journal of Lightwave Technology, 1992, 10(1):96-100.
3. Schmuck H. Comparison of optical millimetre-wave system concepts with regard to chromatic dispersion. Electronics Letters, 1995, 31(21):1848-1849.
4. Gliese U, Norskov S, Nielsen TN. Chromatic dispersion in fiber-optic microwave and millimeter-wave links. IEEE Transactions on microwave theory and techniques, 1996, 44(10):1716-1724.
5. Park J, Sorin WV, Lau KY. Elimination of the fibre chromatic dispersion penalty on 1550 nm millimetre-wave optical transmission. Electronics Letters, 1997, 33(6):512-512.
6. Smith GH, Novak D, Ahmed Z. Overcoming chromatic-dispersion effects in fiber-wireless systems incorporating external modulators. IEEE Transactions on microwave theory and techniques, 1997, 45(8):1410-1415.
7. Wake D, Lima CR, Davies PA. Optical generation of millimeter-wave signals for fiber-radio systems using a dual-mode DFB semiconductor laser. IEEE Transactions on microwave theory and techniques, 1995, 43(9):2270-2276.
8. Hofstetter R, Schmuck H, Heidemann R. Dispersion effects in optical millimeter-wave systems using self-heterodyne method for transport and generation. IEEE Transactions on microwave theory and techniques, 1995, 43(9):2263-2269.
9. Agrawal GP. Nonlinear Fiber Optics. New York, Academic Press, 2013, 648 p.
10. Koch TL, Bowers JE. Nature of wavelength chirping in directly modulated semiconductor lasers. Electronics Letters, 1984, 20(25):1038-1041.
11. Agrawal GP, Dutta NK. Long-wavelength Semiconductor Lasers. Boston, Kluwer Academic Publishers, 2013, 616 p.
12. Petermann K. Laser Diode Modulation and Noise. Dordrecht, Kluwer Academic Publishers, 1991, 315 p.
13. Hilt A, Udvary E, Berceli T. Harmonic distortion in dispersive fiber–optical transmission of microwave signals. Proceedings of International Topical Meeting on Microwave Photonics (Budapest, Hungary 2003), p. 151-154.
14. Peral E, Yariv A. Large-signal theory of the effect of dispersive propagation on the intensity modulation response of semiconductor lasers. Journal of Lightwave Technology, 2000, 18(1):84-89.
15. Bateman H, Erdelyi A. Higher Transcendental functions, v. 2. New York, Mc Graw-Hill book company, 1953, 292 p.
16. Bjerkan L, Royset A, Hafskjaer L, Myhre D. Measurement of laser parameters for simulation of high-speed fiberoptic systems. Journal of Lightwave Technology, 1996, 14(5):839-850.
17. Royset A, Bjerkan L, Myhre D, Hafskjaer L. Use of dispersive optical fiber for characterization of chirp in semiconductor lasers. Electron. Lett., 1994, 30(9):710-712.
18. Srinivasan RC, Cartledge JC. On using fiber transfer functions to characterize laser chirp and fiber dispersion. IEEE Photon. Technol. Lett., 1995, 7(11):1327-1329.
19. Saleh BEA, Teich MC. Fundamentals of photonics. New York, John Wiley & Sons Inc., 1991, 947 p.
20. Koyama F, Iga K. Frequency chirping in external modulators. Journal of Lightwave Technology, 1988, 6(1):87-93.
21. Provost J-G, Grillot F. Measuring the chirp and the linewidth enhancement factor of optoelectronic devices with a Mach–Zehnder interferometer. IEEE Photonics Journal, 2011, 3(3):476-487.
22. Zi-hang Zhu, Shang-hong Zhao, Zhou-shi Yao, Qing-gui Tan, Yong-jun Li, Xing-chun Chu, Xiang Wang, Gu-hao Zhao. Nonlinearity modelling of an on-board microwave photonics system based on Mach-Zehnder modulator. Optoelectronics Letters, 2012, 8(6):441-444.
23. Yejun Fu, Xiupu Zhang, Bouchaib Hraimel, Taijun Liu, Dongya Shen. Mach-Zehnder: a review of bias control techniques for Mach-Zehnder modulators in photonic analog links. IEEE Microwave Magazine, 2013, 14(7):102-107.
24. Svarny J. Bias driver of the Mach–Zehnder intensity electro–optic modulator, based on harmonic analysis. Advances in robotics, mechatronics and circuits (Santorini Island, Greece, 2014), p. 184-189.
25. Villafranca A, Lasobras J, Garcés I. Precise characterization of the frequency chirp in directly modulated DFB lasers. Proceedings of 6th Spanish Conference on Electronic Devices (San Lorenzo de El Escorial, Madrid, Spain 2007), p. 173-176.